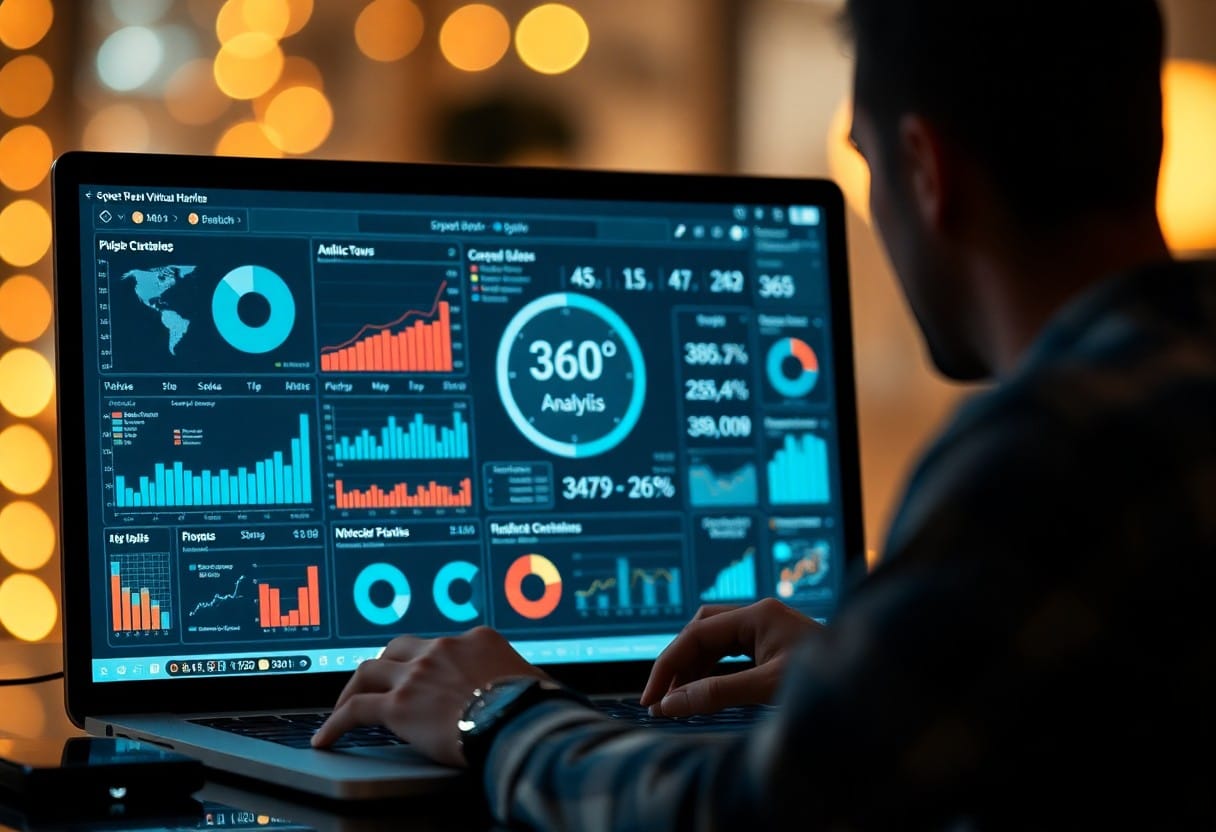
There's a growing interest in analytics tracking for 360° virtual tours, as it provides you with valuable insights into user engagement and behaviour patterns. Understanding how viewers interact with your virtual tour can enhance your marketing strategy and improve user experience. You might be wondering if it's possible to obtain this data, and the good news is that there are various tools and methods available to assist you in tracking these analytics effectively. In this post, we will explore how you can leverage these insights for better outcomes.
Your exploration of 360° virtual tours begins with an appreciation of their immersive nature. These interactive experiences allow users to navigate through spaces as if they were physically present. They are particularly popular in real estate, tourism, and education, providing potential customers with a comprehensive view of a location. To enhance your experience, you can track Analytics to understand user interactions and engagement.
The 360° virtual tour is a visual representation that enables viewers to immerse themselves in a digital environment. It typically consists of panoramic images stitched together, offering a seamless experience where users can explore surroundings interactively. This technology is utilised across various industries to showcase properties, museums, and outdoor attractions, making it a versatile tool for enhanced engagement.
At its core, a 360° virtual tour offers numerous advantages that elevate user engagement. These tours provide an interactive experience, allowing potential customers to explore spaces remotely and at their leisure. This leads to increased interest and enhanced decision-making, which can ultimately drive sales and conversions.
In addition, 360° virtual tours significantly improve customer engagement by presenting information in an immersive way that static images cannot achieve. They are particularly beneficial for showcasing properties, as they allow you to highlight unique features, giving prospective buyers a better sense of the space. Furthermore, virtual tours can lead to higher conversion rates, as clients feel more confident in their decisions after experiencing a realistic view of the space. This innovative approach not only enhances your marketing strategy but also establishes your brand at the forefront of modern technology.
If you want to enhance your virtual tour experience, understanding analytics is key. Analytics provide insights into user interaction, engagement levels, and overall performance of your tour. This data allows you to make informed decisions, improve your offerings, and ultimately drive more interest and conversions from your audience.
Tours provide a unique opportunity to engage with your audience, and tracking analytics helps you measure that engagement effectively. By understanding how users navigate your virtual tour, you can identify areas for improvement, tailor content to better meet their needs, and create a more captivating experience.
On your journey to optimising virtual tours, it’s vital to track several key metrics: user engagement, average time spent, drop-off rates, and conversion rates. By focusing on these metrics, you can assess which aspects of your tour captivate users most and where adjustments may be needed.
But each metric carries significant implications for your virtual tour's success. For example, a high drop-off rate might highlight critical issues in user experience, indicating that visitors lose interest before fully exploring. Additionally, tracking the average time spent can reveal whether your content is engaging. A low conversion rate, on the other hand, can suggest that your call-to-action may need refinement to convert viewers into actual customers. Understanding these aspects allows you to enhance your virtual tour effectively.
Now, understanding the tools available for tracking your 360° virtual tour analytics is crucial for improving user engagement and experience. Various platforms can help you gather data on viewer interactions, user behaviour, and overall traffic sources, enabling you to optimise your content effectively. Utilising these tools can provide valuable insights that assist in refining your marketing strategies and enhancing your virtual tour's performance.
Between Google Analytics, Matomo, and Clicky, you have a wealth of options to choose from when it comes to tracking your virtual tour's performance. Each platform offers unique features to monitor visitor engagement, helping you understand how users interact with your content. Selecting the right one will depend on your specific needs and the depth of analysis you require.
The integration of tracking tools into your virtual tour is straightforward and vital for capturing crucial user data. This process usually involves embedding tracking codes or plugins that automatically collect relevant analytics as visitors interact with your tour.
Understanding the integration of tracking into your tour is fundamentally about ensuring that you can gather the right data. By adding tracking codes to your tour software, you can monitor visitor behaviour, such as the time spent on each scene, click-through rates, and conversion statistics. This data is invaluable for assessing your tour's effectiveness and tailoring it to meet your audience's needs. Additionally, integrating tracking can streamline your marketing efforts, ensuring that your virtual tour not only attracts visitors but also drives engagement and conversions.

After you have gathered your analytics data, the next step is analysis. This involves examining user behaviours, preferences, and engagement patterns to gain insights into their interactions with your 360° virtual tour. By understanding what works well and what doesn’t, you can optimise your content for enhanced user experience and increased engagement. Key metrics, such as time spent on the tour and areas with high interaction rates, will guide you in making informed decisions regarding future updates and improvements.
Around 80% of users’ time is spent on just 20% of your virtual tour's content. This insight is pivotal for identifying which scenes attract the most attention. By determining the most popular areas, you can enhance those sections further, ensuring that users remain engaged and receive the information you aim to showcase. Analysing drop-off points can also reveal potential issues or uninspiring content, providing opportunities for refinements.
For optimal results, using your analytics to inform decision-making is key. This involves tailoring your virtual tour based on user interactions and preferences to create an experience that resonates with your audience.
Interpreting data from your virtual tour allows you to make informed adjustments that align with user interests. By focusing on aspects like popular scenes and interaction trends, you can strategically enhance the tour's content and navigation. Regularly reviewing performance metrics will enable you to adapt to changing user preferences, ensuring your virtual tour remains relevant and engaging. Ultimately, this approach fosters a more personalised experience, leading to higher user satisfaction and improved outcomes.
Despite the complexities involved in tracking analytics for your 360° virtual tour, following best practices can significantly enhance your data collection efforts. Begin by ensuring your analytics tools are appropriately integrated with your virtual tour platform. Regularly review and adjust your analytics settings to capture the most relevant data, allowing you to make informed decisions about your content and user engagement strategies.
Before exploring analytics collection, it's imperative to define clear goals and key performance indicators (KPIs) tailored to your virtual tour. Establish what you wish to achieve—be it increased user engagement, improved conversion rates, or enhanced user experience. By setting measurable objectives, you can effectively gauge the success of your initiatives and refine your approach as needed.
The process of gathering analytics data should not be static; it requires ongoing refinement to enhance your outcomes. You should consistently analyse the data collected to identify patterns and trends that inform your strategies. This dynamic approach enables you to pivot quickly in response to user behaviour and preferences.
Optimising your continuous improvement strategies involves regularly reviewing the data patterns to recognise strengths and weaknesses in your virtual tour experience. Implement feedback loops where you solicit user input to refine the overall experience and adjust your content and features accordingly. By staying proactive, you can ensure your virtual tour remains relevant and engaging, ultimately improving your overall performance and achieving your stated goals.
Keep in mind that while tracking analytics for your 360° virtual tour can provide valuable insights, there are several challenges and limitations that you may encounter. These can stem from various factors, including data accuracy, the complexity of interpretation, and the restrictions of analytics tools. Understanding these issues can help you make informed decisions about how to utilise the data you gather effectively.
Along with technical challenges, privacy concerns can arise when tracking user interactions within a 360° virtual tour. You must ensure that you comply with data protection regulations, such as GDPR. Obtaining user consent and being transparent about data collection practices is necessary to build trust and protect personal information.
Limitations can occur due to the technology employed for tracking analytics. With 360° virtual tours, the data may be less comprehensive than traditional web analytics. This restriction means that you may not capture all user interactions, leading to potentially distorted insights. Furthermore, some virtual tour platforms may lack integration with advanced analytics tools, limiting your ability to analyse data effectively.
And it's important to recognise that the technical limitations of some tracking tools can impact your analytics efforts. The inability to capture specific interactions or the lack of real-time data can hinder your understanding of user behaviour. Additionally, reliance on third-party platforms may result in inconsistent data reporting, making it challenging to draw accurate conclusions. Being aware of these limitations will help you adapt your strategy and choose the right tools to support your analytics goals.
Following this, you can indeed track analytics for your 360° virtual tour. By integrating tools like Google Analytics, you can monitor user engagement, the number of visitors, and how they interact with your tour. This tracking provides valuable insights that can inform your marketing strategies and help you optimise the virtual experience for your audience. Utilising these analytics will allow you to better understand your users and enhance your content accordingly.
A: Yes, you can track analytics for your 360° virtual tour using various tools and platforms. Many virtual tour providers offer built-in analytics features that allow you to gather data on user engagement, such as the number of visitors, the duration of their visits, and the specific areas they interacted with within the tour. Additionally, you can integrate your 360° virtual tour with web analytics tools like Google Analytics to obtain a more comprehensive overview of user behaviour and traffic sources.
A: In your 360° virtual tour, you can track several key metrics, including the total number of views, unique visitors, average time spent on the tour, and the bounce rate. You can also analyse which hotspots or interactive elements received the most clicks, allowing you to understand what aspects of the tour most engage users. Advanced metrics might include user navigation patterns and exit points, providing insights that can help refine future tours.
A: Setting up analytics for your virtual tour typically involves a few straightforward steps. Firstly, if your virtual tour platform supports it, enable the built-in analytics features within the tour editor. Secondly, if you prefer using an external service like Google Analytics, you will need to create a new property in your Google Analytics account and obtain the tracking code. After that, embed the tracking code into the virtual tour's HTML or share the provided URL that contains the analytics tracking parameters. Lastly, monitor your analytics dashboard to gather insights once your tour is live.